pathpy»
«pathpy
pathpy is an OpenSource python package for the modeling and analysis of pathways and temporal networks using higher-order and multi-order graphical models.
The code, reference manual as well as an educational tutorial are available on gitHub.
The package is specifically tailored to analyze sequential data which capture multiple observations of short, independent paths observed in an underlying graph topology. Examples for such data include user click streams in information networks, biological pathways, or traces of information propagating in social media. Unifying the analysis of pathways and temporal networks, pathpy also supports the extraction of time-respecting paths from time-stamped network data. It extends (and will eventually supersede) the package pyTempnets.
pathpy facilitates the analysis of temporal correlations in such sequential data. It uses a principled model selection technique to infer higher-order graphical representations that capture both topological and temporal characteristics of time-resolved relational data. It specifically allows to answer the question whether a (first-order) network abstraction of such data is justified, or whether higher-order network abstractions are needed.
The theoretical foundation of this package, higher-order network models, has been developed in the following research works:
- I Scholtes: When is a network a network? Multi-Order Graphical Model Selection in Pathways and Temporal Networks, Proceedings of the 23rd ACM SIGKDD International Conference on Knowledge Discovery and Data Mining, Halifax, Nova Scotia, Canada
- I Scholtes, N Wider, A Garas: Higher-Order Aggregate Networks in the Analysis of Temporal Networks: Path structures and centralities, The European Physical Journal B, 89:61, March 2016
- I Scholtes, N Wider, R Pfitzner, A Garas, CJ Tessone, F Schweitzer: Causality-driven slow-down and speed-up of diffusion in non-Markovian temporal networks, Nature Communications, 5, September 2014
- R Pfitzner, I Scholtes, A Garas, CJ Tessone, F Schweitzer: Betweenness preference: Quantifying correlations in the topological dynamics of temporal networks, Phys Rev Lett, 110(19), 198701, May 2013
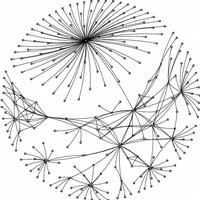
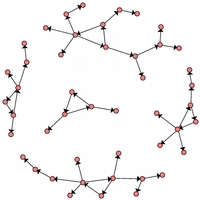
pathpy extends this approach towards multi-layer graphical models that capture temporal correlations in pathways at multiple length scales simultaneously. An illustrative example for a collection of pathways (left) and a multi-order graphical representation of these pathways is shown below. All mathematical details of the framework can be found in this recent research paper.
ETHBeamer»
«ETHBeamer
Here we provide a class file, and the necessary backgrounds in order to create LaTeX presentations according to the ETHZurich format. The class supports both 4:3 and 16:9 aspect ratios, and the use of Helvetica fonts. It is based on the color palette provided by the Corporate Design (CD) Manual. The desired color is passed as a class option with it's respective name: ETH1-ETH9. An example .tex file is provided, to highlight the use of some default options.
Important to know is that the colours Dark Blue ETH 1 and Dark Green ETH 2 are reserved for the corporate level, this applies normally to the Executive Board and the central authorities.
Anyone addressing a target audience inside or outside ETH on behalf of a teaching or research entity, which applies for the usual case, should use one of the colours ETH 3 to ETH 9.
Our class file is based on the general beamer class, so before proceeding make sure that you the beamer package is included in your LaTeX installation.
The package is provided as is, without any support or warranty.
This means "Use at your own risk!", but, if you find any bugs please let us know and we will try to fix them.
ETHBrief»
«ETHBrief
The Chair of Systems Design has provided a template for the ETH Brief style for LaTeX.
By the time of creation in 2005 there was only a general Microsoft Word template for the ETH Brief provided by the ETH.
We filled this gap by providing an additional LaTeX template for those who not use Microsoft Word.
Currently, ETH has build upon this template to create an updated version to match its new format requirements.
You may get this new class from the ETH Corporate Communications website
pyTempNet»
«pyTempNet
pyTempNet is a python module for the analysis of time-stamped relational data represented as temporal networks. It particularly facilitates the analysis of temporal networks from the perspective of higher-order networks, which include causality limitations due to order correlations. This perspective and the resulting analytic measures have been outlined in the papers:
- I Scholtes, N Wider, R Pfitzner, A Garas, CJ Tessone, F Schweitzer: Causality-driven slow-down and speed-up of diffusion in non-Markovian temporal networks, Nature Communications, 5, Sept. 2014
- R Pfitzner, I Scholtes, A Garas, CJ Tessone, F Schweitzer: Betweenness preference: Quantifying correlations in the topological dynamics of temporal networks, Phys Rev Lett, 110(19), 198701, May 2013
The module is written in pure python, has no platform-specific dependencies and should thus work on all platforms. The latest version can be installed by typing:
> pip install git+git://github.com/sg-dev/pyTempNet.git
Tutorial
A detailed educational tutorial showcasing the features of pyTempNet and illustrating its theoretical foundation is available online.
Acknowledgements
The development of this module was generously supported by the MTEC Foundation in the context of the project The Influence of Interaction Patterns on Success in Socio-Technical Systems: From Theory to Practice.
Contributors
Ingo Scholtes (project lead, development)
Roman Cattaneo (development)
Copyright
(c) Copyright ETH Zürich, Chair of Systems Design, 2015-2016
NETVisualizer»
«NETVisualizer
NETVisualizer is an OpenSource, OpenGL-based network and graph visualization framework for .NET 4.0 / Mono 2.10x and higher. Its main features are:
- Efficient rendering of large networks based on OpenGL and OpenTK
- Support for the visualization of temporal networks (both as aggregated and dynamic representation)
- Visualization modes using straight and customizable curved edges
- Integrated PDF export
- Simple and clean network interface that does not impose constraints on how you implement networks in your code
- Simple to use in your own code, a single line of code is sufficient to fire up an OpenGL visualization and start exploring a network
- Easy-to-grasp interface for custom graph layouting algorithms
- Integrated multi-core aware Fruchterman-Reingold layout which makes use of all available cores
- Integrated frame grabbing capabilities that allow to produce high quality videos
- Full mouse control allows panning, zooming and selection of nodes
- Fully customizable coloring of background, nodes and edges
- Node and edge sizes and colors can be conveniently and dynamically computed based on elegant lambda expression interface
- No external dependencies except OpenTK (libraries included)
- Fully documented: Each method and field is explained and in-method comments help you to understand and extend the existing code
- Integrated, maximally simple demo that can be used as boilerplate code for your own project
- Platform-independent, built on OpenTK, runs on Windows, MacOS X and Linux
The fully documented source code is available on a dedicated gitHub project page.
Please note that NETVisualizer shares parts of its OpenGL rendering backend with our graph layout software Cuttlefish.
pyFastLayout»
«pyFastLayout
pyFastLayout provides a highly efficient, parallel implementation of the Fruchterman-Reingold layout algorithm. The module has been implemented as a native C-extension to python.
The module is freely available on gitHub.
multinet.js»
«multinet.js
Multinet.js is a visualization framework for large, dynamic and multi-layered graphs developed by the Chair of Systems Design at ETH Zurich. The front-end is based on three.js, while the back-end uses igraph and Flask to deliver layout information to the front-end.
Our deployment of the framework can be accessed from this link.
Multinet.js source code is freely available on gitHub.
License
multinet.js is distributed under the terms of the BSD 3-Clause License.
See LICENSE for details.
ARF graph layout»
«ARF graph layout
Abstract
As Networks and their structure have become a major field of research a strong demand to visualize these networks has emerged. We address this challenge by formalizing the well established spring layout in terms of dynamic equations. We thus opening up the design space for new algorithms. Drawing from the knowledge of systems design, we derive a layout algorithm that remedies several drawbacks of the original spring layout. This new algorithm relies on the balancing of two antagonistic forces. We thus call it ARF for "attractive and repulsive forces''. It is, as we claim, particularly suited for dynamic layout of smaller networks. We back this claim with several application examples from on going complex systems research.
Publication
Markus M. Geipel: Self-Organization applied to Dynamic Network Layout,
International Journal of Modern Physics C, pages: 1537-- 1549, volume: 18, number: 1
Demonstrations
The following video shows ARF at work. It addapts the layout to the constantly changing graph topology:
ARF was also used to visualize results in the field of innovation network research. The videos show simulations of the evolution of R&D cooperations between firms. They were presented on the WEHIA 06 conference.
James Glattfelder produced a fancy 3D fly though video posted on YouTube.
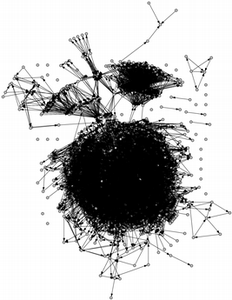
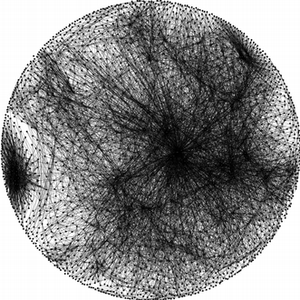
The following graph shows class dependencies in an open source java project (circa 2500 classes). One layout was generated with neato and the other one with ARF (graph data)
If you achieve better layout results with neato then the one presented here, please let me know. In this case, I will gladly update the page.
Cuttlefish
The graphlayout lead also to a SourceForge project >>
- dot files: dotfiles.zip
The zip file contains all the dot files of the sample graphs, as well as a shellscript to layout them with all layouters available in graphviz.
- java source: netbrowser.jar
This archive includes an implementation of the ARF Layouter for the JUNG Framework. See Layout Appletfor an example how to use layouts in JUNG.
The archive also containes a prototypical implementation of the network browser mentioned in the paper.
How to run the browser
Add the jar file to your classpath and start the browser as follows:
java ch.ethz.sg.arf.netbrowser.NetworkBrowserFrame
The browser starts with an arbitrary random network. If you want to browse your own networks, just write a class that extends the ANetModel class. This way, you can plug any data source into the browser. See the comments in the code for details. To load your network, use the following command:
java ch.ethz.sg.arf.netbrowser.NetworkBrowserFrame YourNetModelClass StartNodeId
Please note, that the network browser and the ARF implementation are prototypical implementations. They are meant as a proof of concept and nothing more. However, you are free to use and extend the code unter the GNU General Public License as published by the Free Software Foundation.
Online Material»
«Online Material
Here we provide online material related to publications.
Firm Ownership Networks
Data»
«Data
IRC-20Channels
The data are freely available for research purposes. If you make use of this dataset, please cite A. Garas, D. Garcia, M. Skowron, F. Schweitzer, Scientific Reports 2, 402 (2012).
This dataset is provided as Supplementary Information for the article "Emotional persistence in online chatting communities"
Garas, Antonios;
Garcia, David;
Skowron, Marcin;
Schweitzer, Frank
OSS dependency networks
These data on co-change and dependency networks of 35 JAVA projects are freely available for research purposes. If you make use of this dataset, please cite M.M. Geipel, F. Schweitzer: Software change dynamics: evidence from 35 java projects, ESEC/FSE '09 (2009).
Please find the data here
|